
A quick post which took ages to prepare (the graph bit; just couldn’t get Excel to do it. In the end got it to do most of it, the printed that and did rest by hand!)
Some estimates of a few of the more steep walking tracks in the Dandenongs:
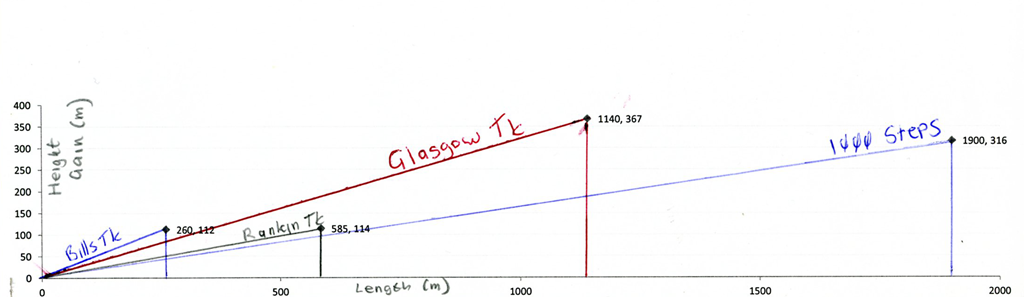
| Name | Length (m) | Height Gain(m) | Gradient (h/l) * 100 |
| Bills Track | 260 | 112 | 43% |
| Rankin Tk | 585 | 114 | 19% |
| 1000 Steps | 1900 | 316 | 17% |
| Glasgow Tk | 1140 | 367 | 32% |
It seems that 1000 Steps is the ‘most gentle’ at least in terms of average Gradient. But it’s the longest. I’d suggest that Glasgow is the most difficult (long and steep) and Bills the second most (shortish but very steep). I did Rankin and Bills yesterday. Both will make you puff.
Here’s the graphs. Hopefully it makes sense. I did it with the same scale for both axes (approx.), so the slopes are realistic. Click on to get larger version:
Here they are on the one Google Earth screen. Closest = 1000 Steps (red), then Bills (green), Rankin (orange) and Glasgow (blue). Height doubled for effect. Click on to enlarge:
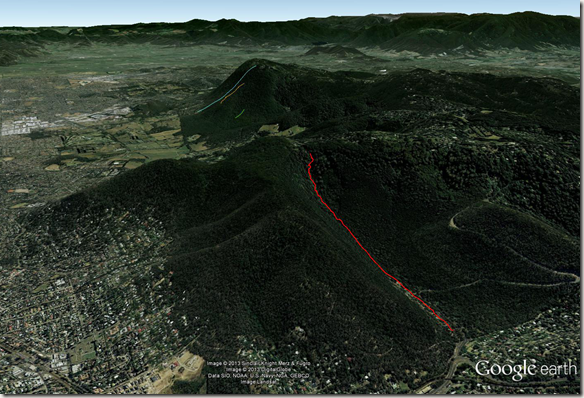
Disclaimer: these are from GPS plots put into Google Earth. I’d estimated where the climbs started and ended. 1000 Steps doesn’t seem quite right to me, but will double check.
Whilst Height Gain is unambiguous, I’m not so sure about Length. Too much to go into here#, but I think the discrepancy is (hopefully) small and so my Length and Gradient values are about right.
# Can’t resist wondering? Well: Look at the 1000 Steps blue-triangle above. I think the GPS is saying the total length of the “1000 Steps” blue line should be the 1900m. I’ve plotted the ‘wrong’ value (1900m) In fact you’d need to do some high school trig to work out the ‘correct’ value to graph, being the actual length of the ‘opposite’ side of that blue line, viz. the X (horizontal) axis component of the triangle. Your ‘adjacent’ (316 m) would help with the maths. As I said, the different should hopefully be small.